
100 Days of Jump Rope Didn’t Fix Everything
In an earlier post about my InBody results, I mentioned that the same checkup packet also had cholesterol, liver enzyme, and blood sugar numbers in it. Honestly, I half expected that after 100-plus days of jump rope, those would have quietly normalized too. When I actually opened up my July checkup results, that wasn’t quite the case. Some things improved. Some didn’t.
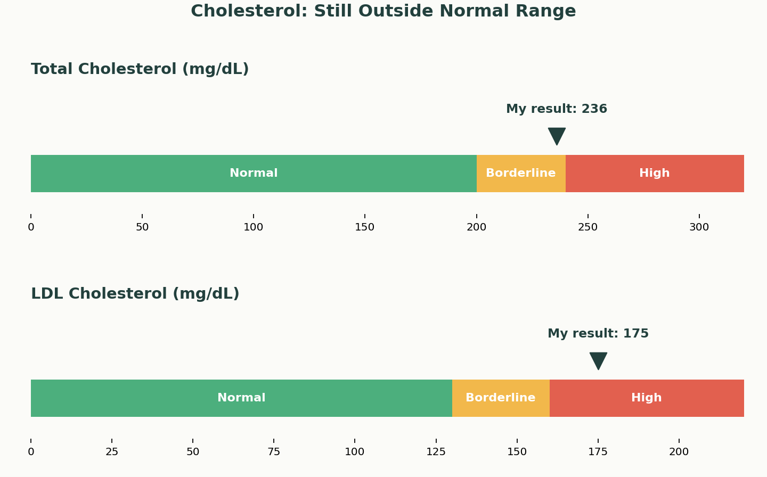
Cholesterol: Total 236, LDL 175
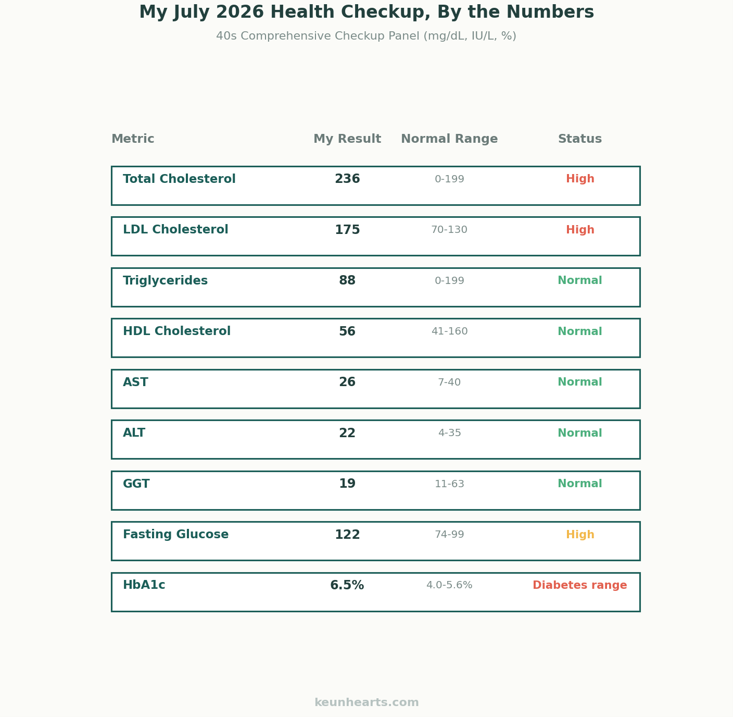
The number that stood out most was cholesterol. Total cholesterol came in at 236 (normal is under 199) and LDL cholesterol at 175 (normal is 70-130), both well outside the normal range. Triglycerides, on the other hand, were 88, and HDL was 56, both inside normal. The report itself noted that my total cholesterol and LDL were elevated and recommended I see a doctor, since medication might be needed. Losing weight and exercising consistently doesn’t automatically bring cholesterol down with it, and this was my first real confirmation of that.
Liver Enzymes (AST, ALT, GGT): All Three Normal
There was good news too. My liver enzymes came back AST 26 (normal 7-40), ALT 22 (normal 4-35), and GGT 19 (normal 11-63), all comfortably inside normal range. I’d been a little worried about fatty liver given the earlier signs, so this felt like a real payoff from the jump rope and weight loss.
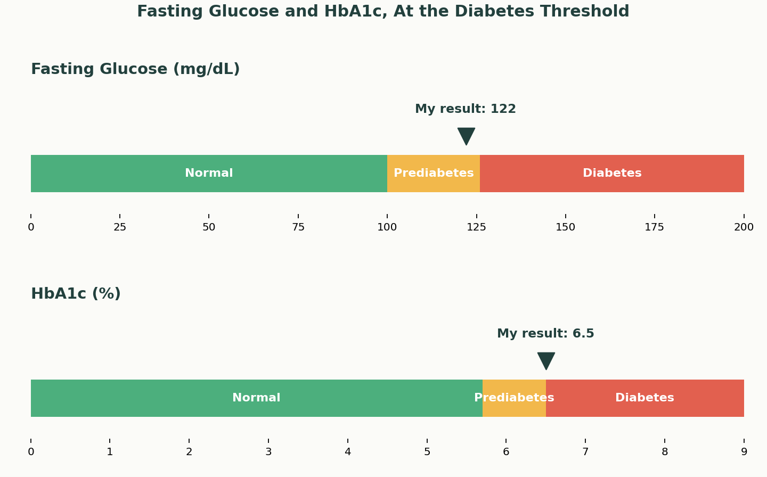
Fasting Glucose 122, HbA1c 6.5%: Right at the Diabetes Threshold
The number that concerned me most was blood sugar. My fasting glucose was 122 (normal is 74-99, and 100-125 is classified as impaired fasting glucose), and my HbA1c, which reflects average blood sugar over roughly two to three months, was 6.5%. Normal range is 4.0-5.6%, and 6.5% or higher meets the diagnostic threshold for diabetes. The report specifically noted the elevated HbA1c and recommended I see a doctor for an accurate diagnosis and treatment if needed. This isn’t something I can assess on my own, so I’m planning to follow up with a doctor soon to get a clear answer.
Why I’m Writing Down the Good and the Not-Yet-Good Together
When people hear I went from 90.9kg to 75.3kg with jump rope, the assumption is usually that everything’s fixed now. My actual checkup results weren’t that tidy. Liver enzymes clearly improved, and triglycerides and HDL are normal, but cholesterol and blood sugar are still past the line. Losing weight and getting a specific lab value back to normal turned out to be two different things, and now I have the numbers to prove it.
Wrapping Up
It’s tempting to only write down the numbers that improved, but this time I’m keeping the ones that haven’t right alongside them. I’m planning to follow up with a doctor about the cholesterol and blood sugar numbers, as the report recommended, and I’ll share what comes of that later. Jump rope alone didn’t fix everything, and that’s something I want this blog to reflect honestly too.