What Did My Old InBody Numbers Actually Mean?
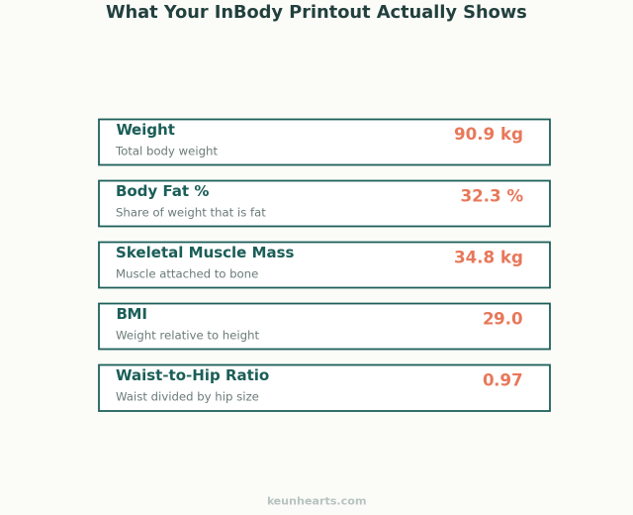
In an earlier post I mentioned the InBody results I got at a clinic in early March: weight 90.9kg, body fat 32.3%, BMI 29.0, waist-to-hip ratio 0.97. At the time, I saw the numbers printed in red ink and knew something was wrong, but not exactly what — I just filed it under “bad.” This time, I went back and actually looked up what each of those numbers means.
Body Fat 32.3% — Where Does That Fall for a Man?
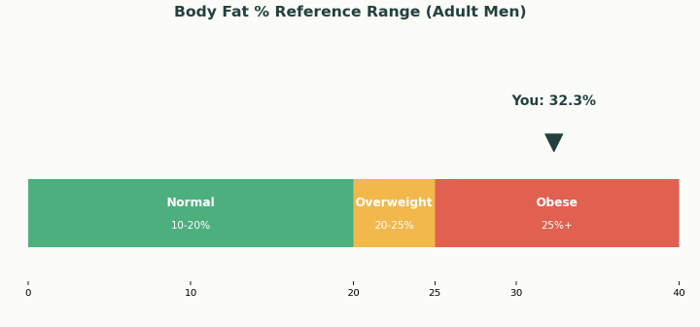
Body fat percentage is the share of your total weight that’s fat. InBody’s recommended range for men is roughly 10–20%, and 25% or higher is generally classified as obese. At 32.3%, I wasn’t just outside the normal range — I was well past the obesity line. The number felt overwhelming at first, but flipping it around, it also gave me a clear target: just get back inside the normal range.
Why BMI 29.0 Needs to Be Read Alongside Body Fat
BMI is calculated from just height and weight. Generally, 20~25 is normal, 25~29.9 is overweight, and 30+ is obese. At 29.0, I was at the very edge of overweight, right before the obesity line. But BMI alone misses something important: people with a lot of muscle mass can also score high on BMI. That’s why you need to look at body fat percentage alongside it to get the real picture. In my case, both numbers were high, so both genuinely needed to come down.
Waist-to-Hip Ratio 0.97 — The Real Problem Was My Waist
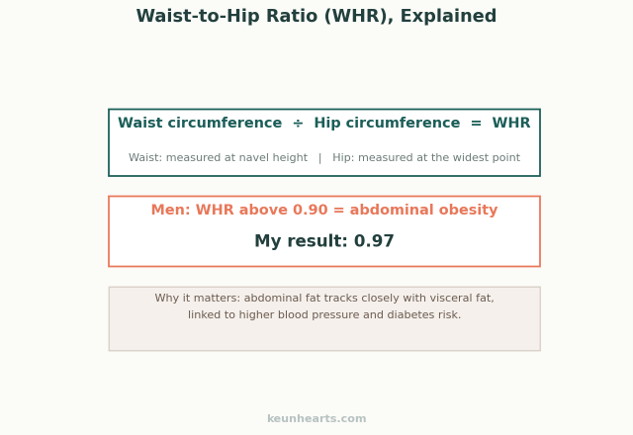
Waist-to-hip ratio is your waist measurement divided by your hip measurement — waist taken at navel height, hips at the widest point. For men, a ratio above 0.90 is classified as abdominal obesity. Mine was 0.97, well past that line, and the printout had the “abdominal obesity” box checked. I’ve since read that abdominal fat is closely tied to visceral fat, which can contribute to conditions like high blood pressure and diabetes. That’s when the seriousness of it actually started to sink in.
What Skeletal Muscle -0.3 and Target Fat Loss -18.5kg Told Me
At the bottom of the printout were a few more numbers: skeletal muscle mass -0.3, fat mass +3.2, and a target fat loss of -18.5kg. That meant I’d been losing muscle while only gaining fat, and the -18.5kg figure was InBody’s calculation of how much fat I’d need to lose to hit its standard reference body composition. I didn’t end up losing the full 18.5kg, but by going from 90.9kg to 75.3kg — a 15.6kg drop — both my body fat percentage and waist-to-hip ratio moved much closer to normal.
Wrapping Up
Body fat 32.3%, BMI 29.0, waist-to-hip ratio 0.97. At first these just looked like bad numbers. Once I understood what each one actually meant, it became obvious exactly what needed to change. A lot of people get a health checkup or InBody printout and skip past it because the numbers feel unfamiliar — but just knowing the reference lines for each metric makes it much easier to understand where your body actually stands.