
It Started With One InBody Printout
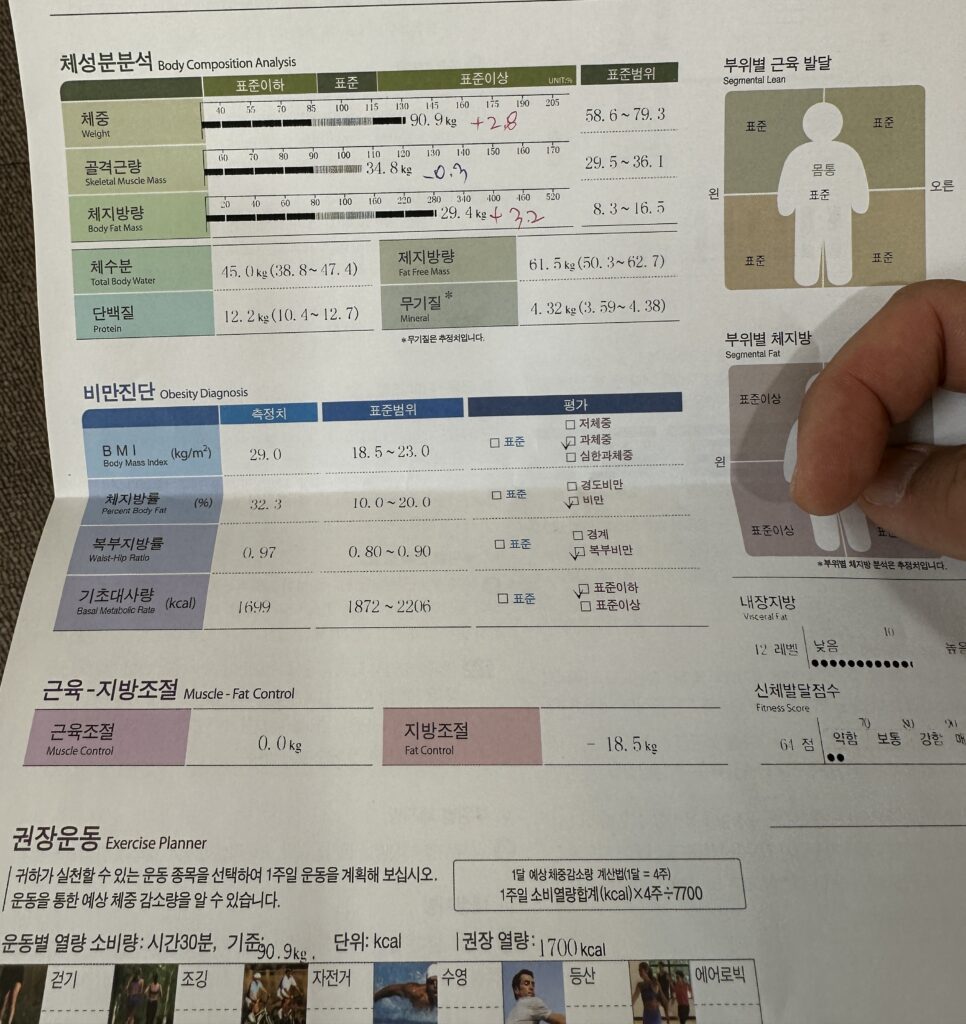
In early March, I went to a clinic for physical therapy on my back and shoulder, and while I was there, I got an ‘InBody’ scan almost as an afterthought. The numbers weren’t kind: 90.9kg, body fat 32.3%, BMI 29.0. The printout had red ink next to some of the lines body fat +3.2, weight +2.8 compared to a healthy range, skeletal muscle mass -0.3. My waist-to-hip ratio was 0.97, checked off in the “abdominal obesity” box, and the recommended fat-loss line read -18.5kg. I wasn’t exactly prepared to be confronted with all that on an ordinary day. I thought about signing up for personal training, or maybe swimming. In the end I picked the option that required the least friction: jump rope. It’s free, I could do it anywhere, and my son could join in.
March 14, 2026: Starting With 300 Jumps
Day one was 300 jumps with my son. The next day, 310. The day after, 320. Even that little was enough to leave me out of breath. After a short break, I started doing 500 jumps alone from March 18th, and by the end of March I’d crossed 1,000 for the first time.
The 100-Day Numbers
| Metric | Result |
| Total jumps | 129,880 |
| Days logged / total days | 92 / 100 |
| Average per logged day | 1,412 |
| Personal best | 2,000 (May 5, 2026) |
| First recorded count | 300 (March 14, 2026) |
Week one, my daily average was 386. By week five I was holding steady around 1,500 a day, and somewhere between weeks nine and twelve I was regularly hitting the 1,600s. I took 8 days off in total bad days, or days I genuinely couldn’t find the time and I didn’t force myself to make them up. Still, logging 92 out of 100 days surprised even me.
Filming Started on Day 53
Honestly, I didn’t plan to document any of this at first. I just typed a number into my Google Calendar every day. Then, on day 53, I started recording video a little late, but at least from that point on I could actually check my form. Those clips are sitting in a private YouTube account now.
How My Body Actually Changed
My InBody numbers from early March were: weight 90.9kg, body fat 32.3%, fat mass 29.4kg, skeletal muscle mass 34.8kg. When I got scanned again between late June and early July — past the 100-day mark — my weight had come down into the 76–80kg range, and body fat had dropped into the low 20s.
| Date | Weight | Body Fat % |
| Early March 2026 (before) | 90.9kg | 32.3% |
| June 20, 2026 | 80.8kg | 21.7% |
| June 22, 2026 (Day 100) | 80.0kg | 23.0% |
| June 25, 2026 | 79.4kg | 22.4% |
| July 1, 2026 | 78.4kg | 22.5% |
| July 5, 2026 | 76.6kg | 20.7% |
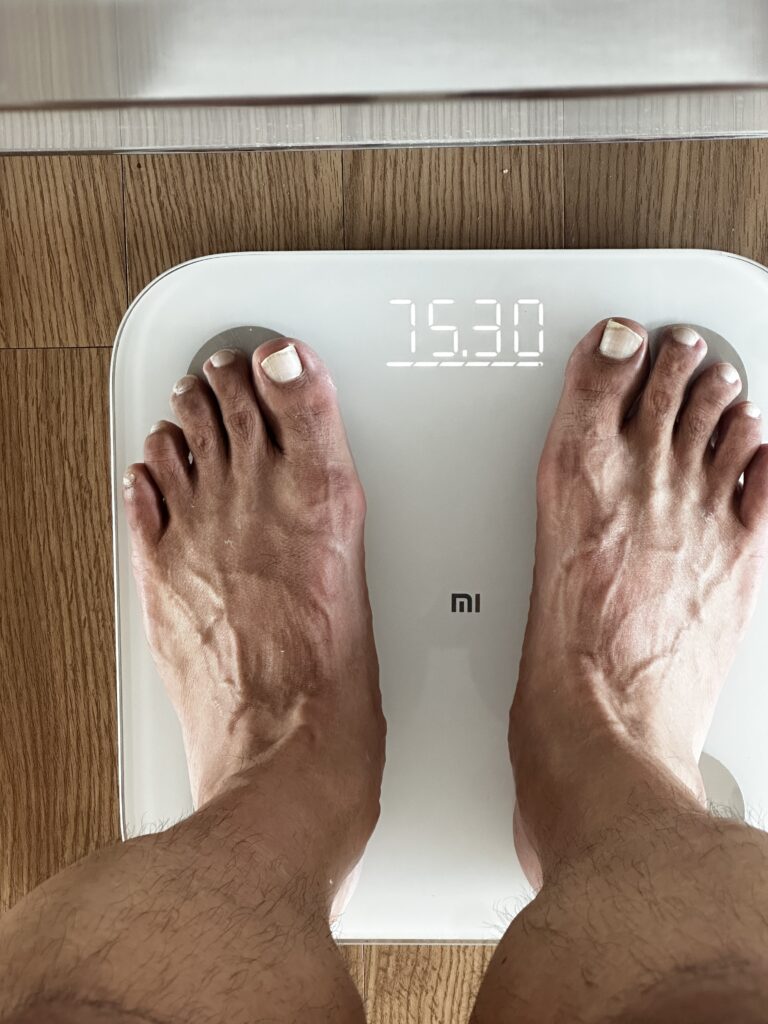
| July 7, 2026 (bathroom scale) | 75.3kg | – |
| July 9, 2026 | 77.5kg | 22.0% |
I lost close to 15kg, but my skeletal muscle mass barely moved it stayed in the 33~35kg range the whole time. That’s the part I’m proudest of: the numbers show this wasn’t just starving the weight off, it was exercise doing the work. My waist and back look different now, and the thing I notice most I’m not out of breath climbing stairs anymore.
<Early March,2026 body shape>
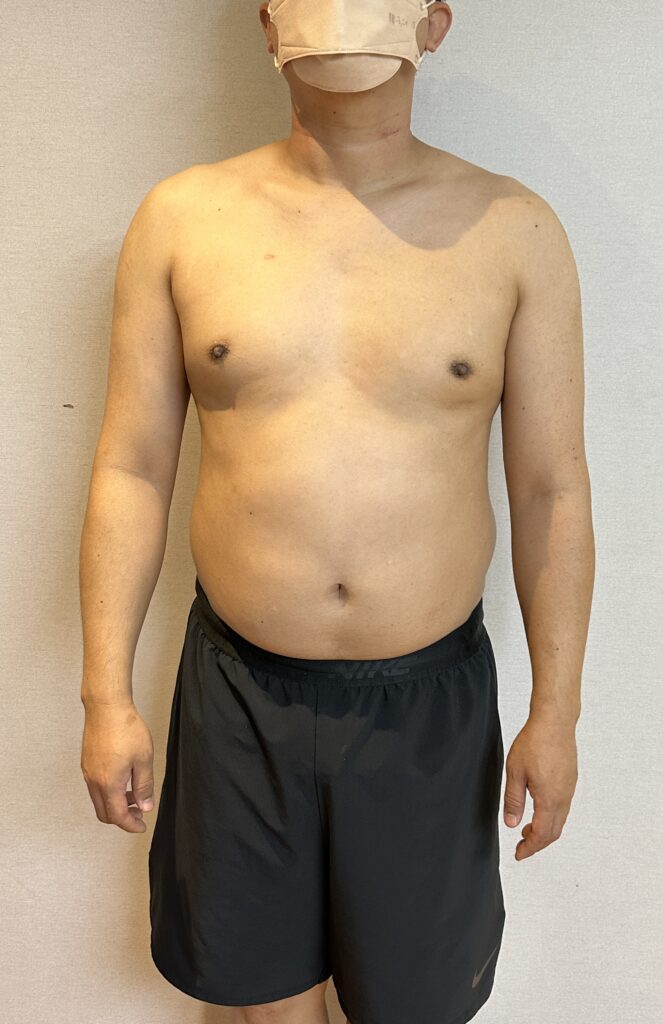
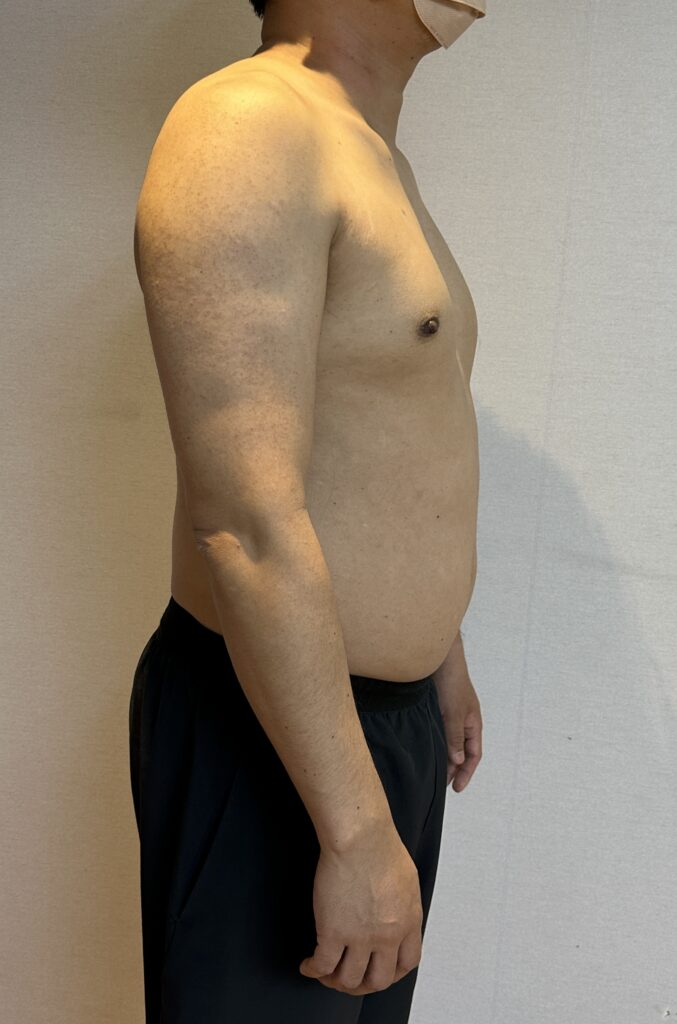
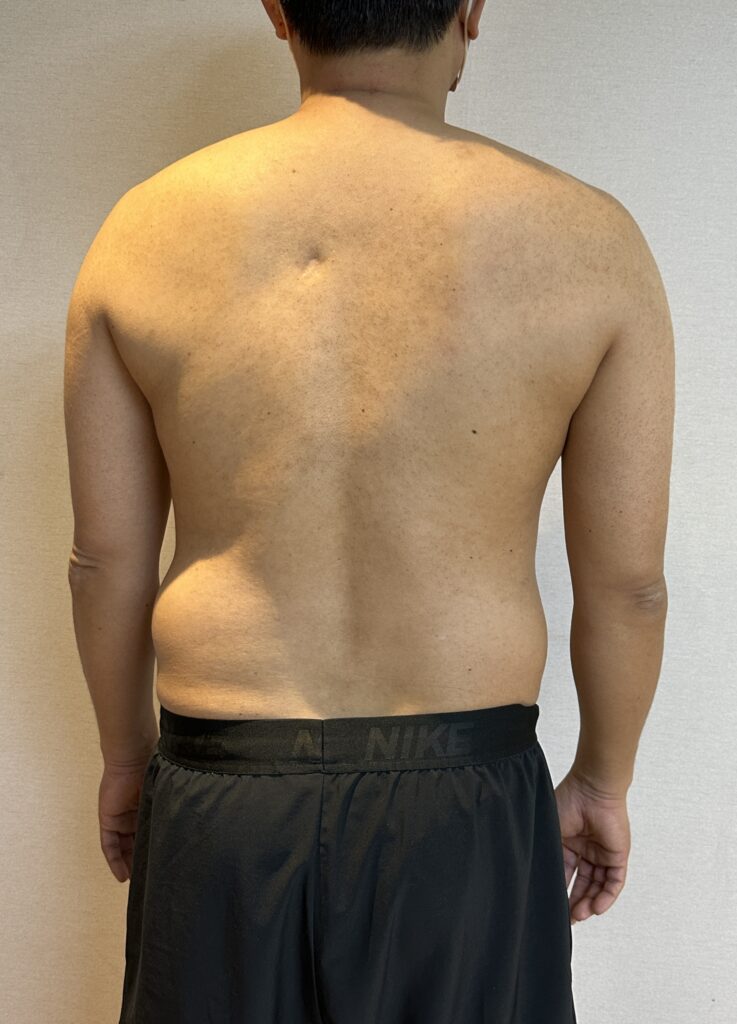
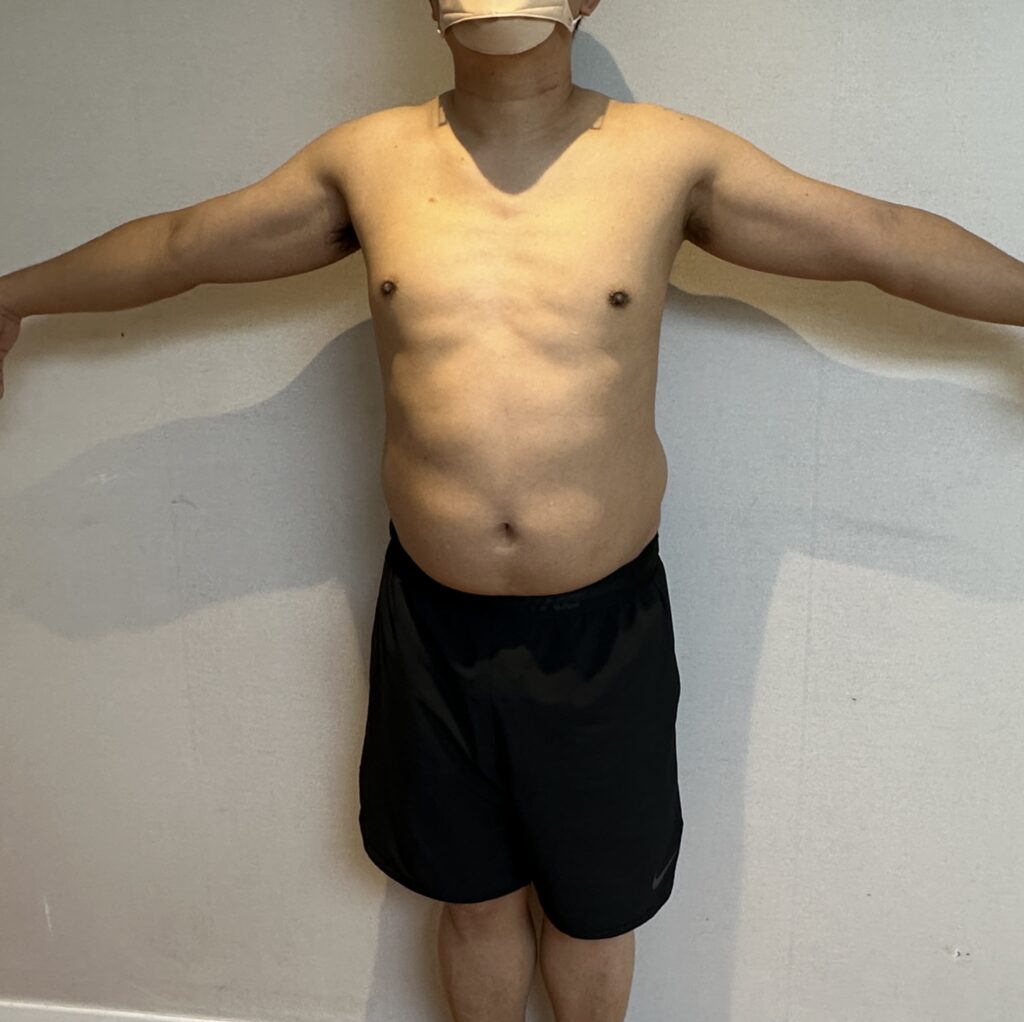
<Early March 2026 INBODY Results>
<Recent Body Condition while Jump Roping>

<Body Weight Scale, July 7, 2026>
Looking Back on 100 Days
There was no grand plan here just a shock from a piece of paper at a clinic that turned into 100 days. 300 jumps used to wreck me; now 1,600 barely registers. I missed days, I lost track sometimes, but I learned in my body that consistency beats perfection.
Next up: build more muscle and keep adjusting body fat to get closer to the shape I actually want. And now that my son has quit basketball and put on a bit of weight, I’m planning to help him build a routine too though he’s in middle school now, so we’ll see how that goes. There’s a chance he’ll be the one asking me to jump rope with him someday, so I plan to keep this habit going either way.